Note
Click here to download the full example code
Hegselmann-Krause
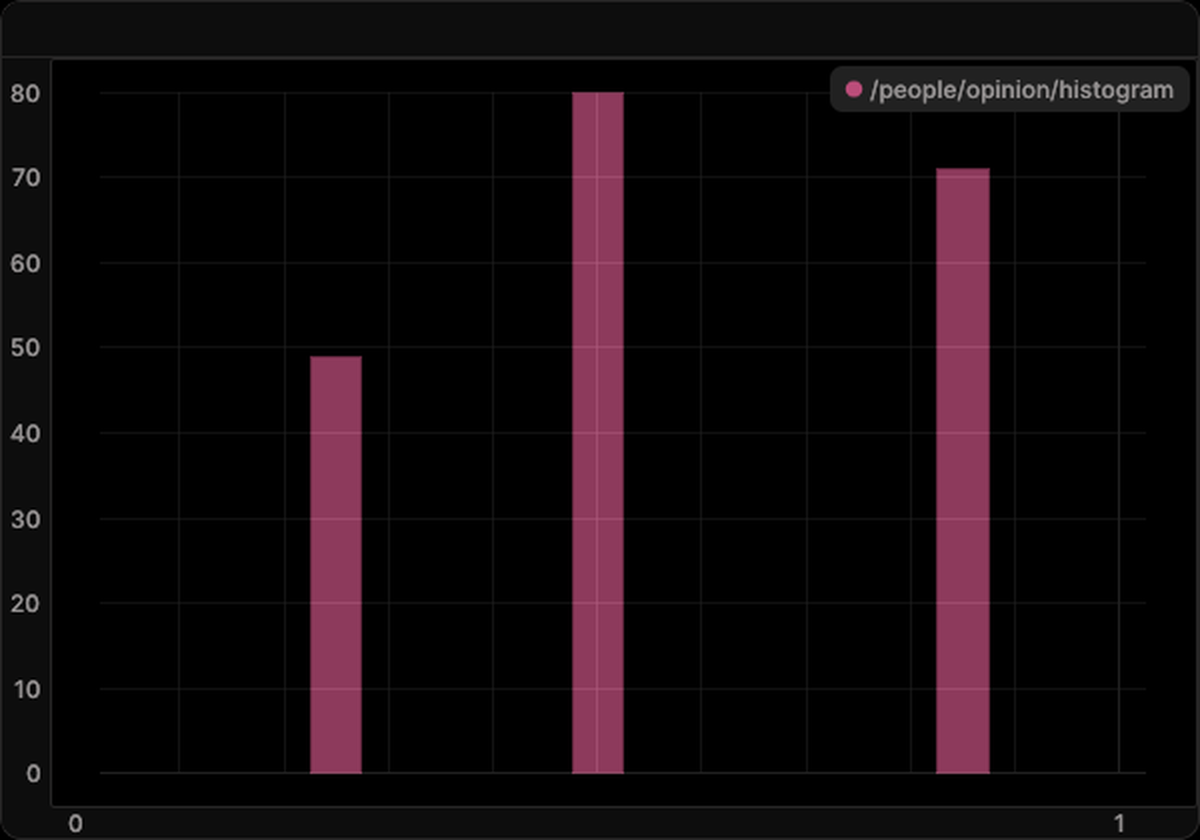
Every step every agent moves at once to the mean opinion of the agents within its confidence ε = 0.15. Uniform
opinions contract within a few steps into three frozen clusters, the three bars of the histogram, more than ε
apart.
The 200 agents sit on the complete graph. The histogram of the opinions comes first, followed by their mean and spread over time.
import matplotlib.pyplot as plt
import numpy as np

from skcomplex.engine.runtime import Simulation
from skcomplex.engine.viz import RerunObserver
from skcomplex.models import create

MODEL = 'hegselmann_krause'

observer = RerunObserver(MODEL, save_path=f'{MODEL}.rrd', blueprint='default', interval=1)
simulation = Simulation(create(MODEL), observers=[observer], random_state=0).check().prepare().run(until=20)
opinions = simulation.trajectory_.values('people.opinion')
Open the recording in the Rerun viewer
Trajectories and the number of clusters
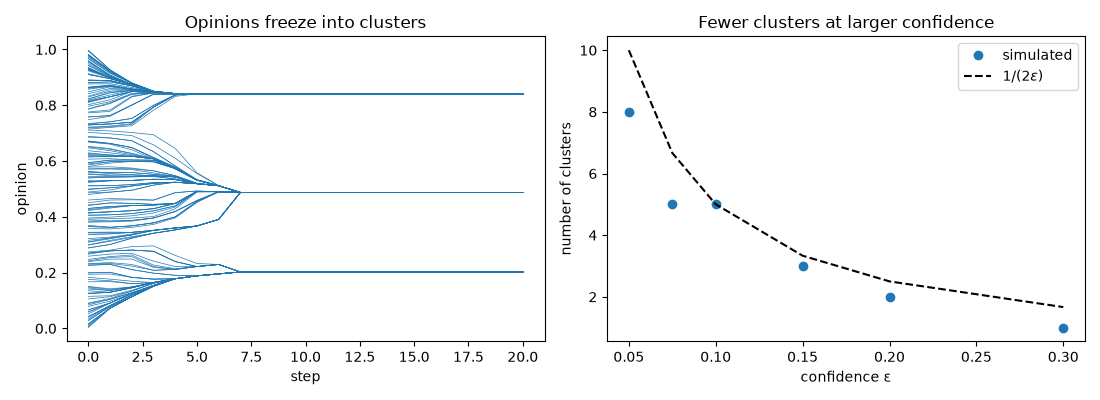
Every opinion should stop moving after a handful of steps, and the number of clusters should follow about
1 / (2 ε) as the confidence shrinks.
confidences = np.array([0.05, 0.075, 0.1, 0.15, 0.2, 0.3])
clusters = []
for confidence in confidences:
    run = Simulation(create(MODEL, confidence=confidence), random_state=0).check().prepare().run(until=40).trajectory_
    clusters.append(np.unique(np.round(run.values('people.opinion')[-1], 6)).size)
fig, (paths, counts) = plt.subplots(1, 2, figsize=(11, 4))
paths.plot(simulation.trajectory_.times, opinions, lw=0.5, color='C0')
paths.set_xlabel('step')
paths.set_ylabel('opinion')
paths.set_title('Opinions freeze into clusters')
counts.plot(confidences, clusters, 'o', label='simulated')
counts.plot(confidences, 1 / (2 * confidences), 'k--', label=r'$1 / (2\varepsilon)$')
counts.set_xlabel('confidence ε')
counts.set_ylabel('number of clusters')
counts.set_title('Fewer clusters at larger confidence')
counts.legend()
fig.tight_layout()
plt.show()
About the model
The Hegselmann-Krause model, whose opinions freeze within a few steps into clusters about 2 ε apart.
References
- Hegselmann and Krause 2002
- Castellano, Fortunato, and Loreto 2009
Total running time of the script: ( 0 minutes 1.336 seconds)
Download Python source code: plot_hegselmann_krause.py