Note
Click here to download the full example code
Correlated geometric Brownian motions
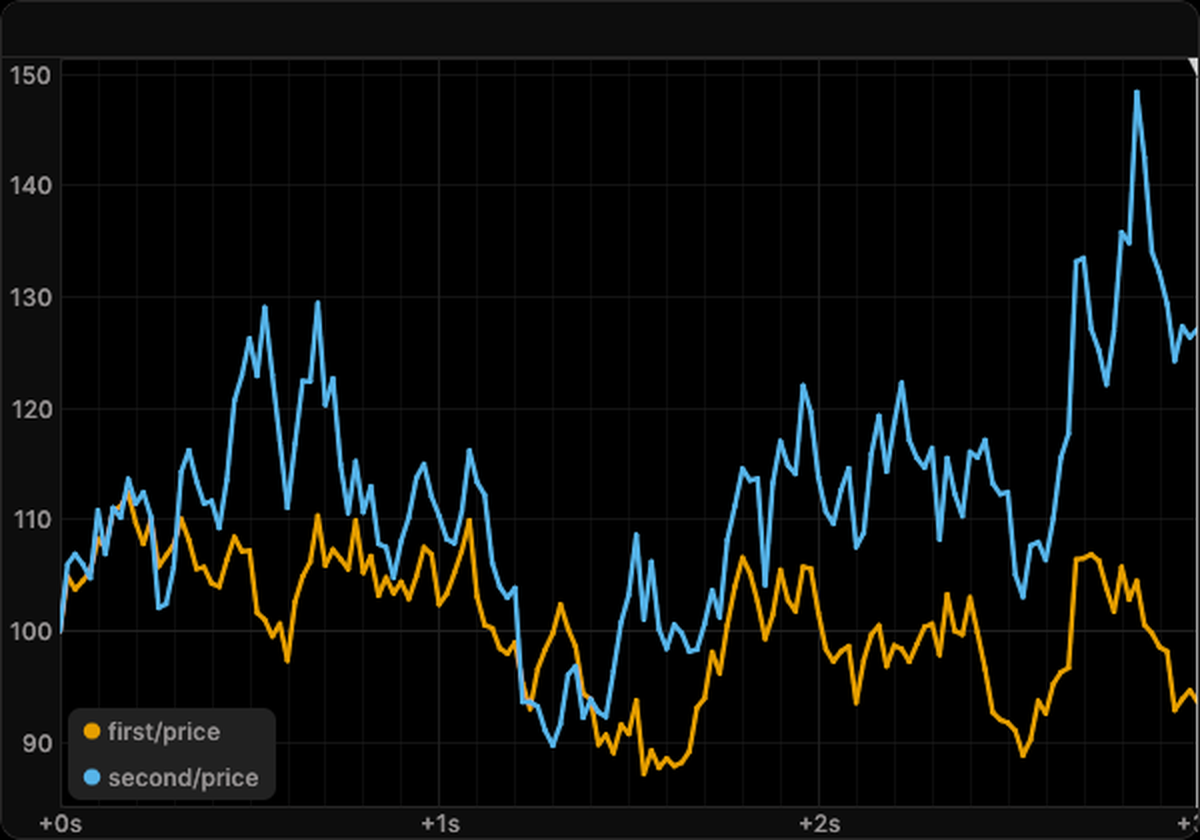
Two asset prices follow geometric Brownian motions driven by the two processes of one WienerProcess, whose
covariance gives them the correlation rho = 0.7. The prices wander apart on their own drifts and volatilities, but
they rise and fall together, and their log returns are correlated with rho.
The model is created by name from the catalog with prices of 100, drifts of 5 and 8 percent, and volatilities of 20
and 30 percent a year. It is simulated for three years in frames of 0.02 with the Euler-Maruyama scheme. The default
blueprint shows both prices in one time series view. The WienerProcess that both motions bind is no component and
draws no view.
import matplotlib.pyplot as plt
import numpy as np

from skcomplex.engine.runtime import Simulation
from skcomplex.engine.solvers import EulerMaruyamaSolver
from skcomplex.engine.viz import RerunObserver
from skcomplex.models import create

MODEL = 'correlated_geometric_brownian_motion'
RHO = 0.7

system = create(MODEL, rho=RHO)
observer = RerunObserver(MODEL, save_path=f'{MODEL}.rrd', blueprint='default')
solver = EulerMaruyamaSolver(dt=0.001)
simulation = (
    Simulation(system, dt=0.02, solver=solver, observers=[observer], random_state=0).check().prepare().run(until=3)
)
Open the recording in the Rerun viewer
Correlated log returns
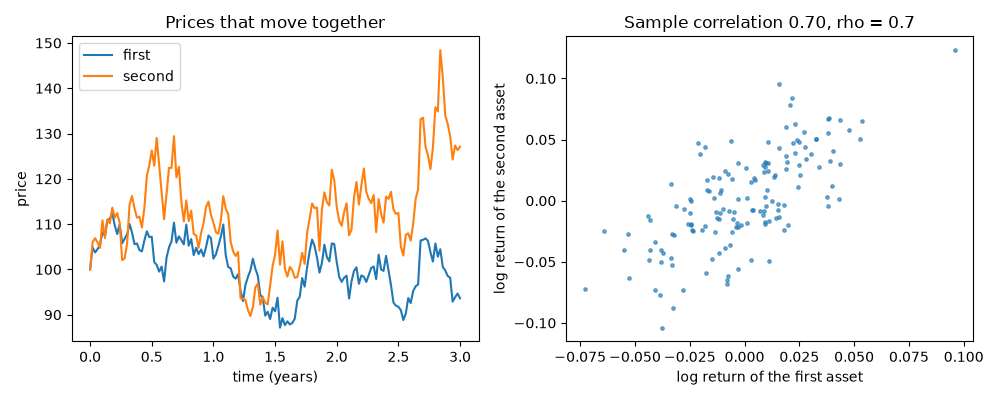
Over one frame the log return of each asset is its volatility times its Wiener increment plus a small drift, so the
sample correlation of the two series of log returns should be close to rho, and their scatter should be an ellipse
tilted along the diagonal.
trajectory = simulation.trajectory_
first, second = (np.diff(np.log(trajectory.values(f'{label}.price'))) for label in ('first', 'second'))
correlation = np.corrcoef(first, second)[0, 1]
fig, (paths, returns) = plt.subplots(1, 2, figsize=(10, 4))
paths.plot(trajectory.times, trajectory.values('first.price'), label='first')
paths.plot(trajectory.times, trajectory.values('second.price'), label='second')
paths.set_xlabel('time (years)')
paths.set_ylabel('price')
paths.set_title('Prices that move together')
paths.legend()
returns.scatter(first, second, s=6, alpha=0.6)
returns.set_xlabel('log return of the first asset')
returns.set_ylabel('log return of the second asset')
returns.set_title(f'Sample correlation {correlation:.2f}, rho = {RHO}')
fig.tight_layout()
plt.show()
Download Python source code: plot_correlated_geometric_brownian_motion.py
Download Jupyter notebook: plot_correlated_geometric_brownian_motion.ipynb
Gallery generated by mkdocs-gallery
About the model
Two assets whose prices follow geometric Brownian motions driven by correlated Wiener processes.
References
- Black and Scholes 1973
- Merton 1973