Note
Click here to download the full example code
Julia set
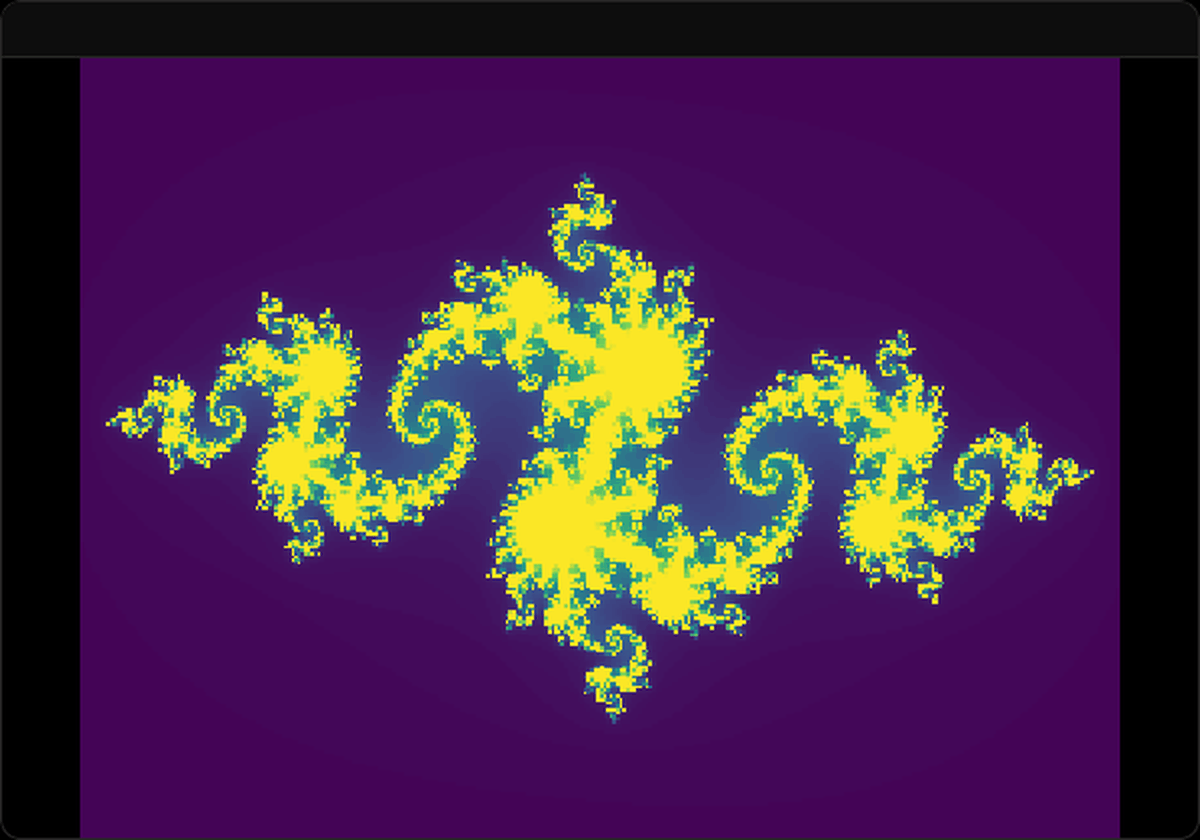
With the constant c = -0.8 + 0.156i, every starting point z iterates z -> z^2 + c. The points of the filled Julia
set stay bounded and the others escape, and the boundary between them is a connected curve with spirals at every
scale, because c lies inside the Mandelbrot set.
The model is created by name from the catalog on a lattice of 240 by 320 starting points. The map runs for 100 steps, and the observer saves every fifth frame with the default blueprint, whose primary view is the image of the escape counts.
import matplotlib.pyplot as plt
import numpy as np

from skcomplex.engine.runtime import Simulation
from skcomplex.engine.viz import RerunObserver
from skcomplex.models import create

MODEL = 'julia'
WINDOW = (-1.6, 1.6, -1.2, 1.2)

system = create(MODEL, c=-0.8 + 0.156j, shape=(240, 320), window=WINDOW)
observer = RerunObserver(MODEL, save_path=f'{MODEL}.rrd', blueprint='default', interval=5)
simulation = Simulation(system, dt=1, observers=[observer]).check().prepare().run(until=100)
Open the recording in the Rerun viewer
Symmetry of the escape times
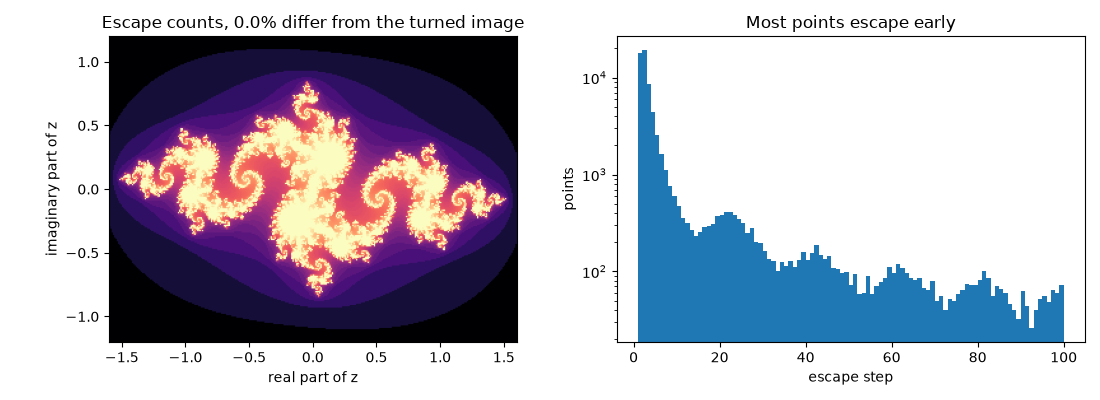
The map commutes with z -> -z, so the escape count of z should equal that of -z, and the image should equal
itself turned by half a turn. The histogram shows most points escape within a few steps, and a slowly decaying tail
of points near the boundary takes many more.
counts = simulation.trajectory_.lattice('plane.n')[-1]
mismatch = np.mean(counts != counts[::-1, ::-1])
fig, (image, histogram) = plt.subplots(1, 2, figsize=(11, 4))
image.imshow(np.log1p(counts), extent=WINDOW, cmap='magma')
image.set_xlabel('real part of z')
image.set_ylabel('imaginary part of z')
image.set_title(f'Escape counts, {mismatch:.1%} differ from the turned image')
histogram.hist(counts[counts < counts.max()].ravel(), bins=np.arange(1, 101), log=True)
histogram.set_xlabel('escape step')
histogram.set_ylabel('points')
histogram.set_title('Most points escape early')
fig.tight_layout()
plt.show()
About the model
The filled Julia set of z -> z^2 + c, the starting points whose orbit stays bounded (Dilão 2023 §5.5).
References
- Dilão 2023
Total running time of the script: ( 0 minutes 2.434 seconds)
Download Python source code: plot_julia.py