Note
Click here to download the full example code
Agent-based SIR
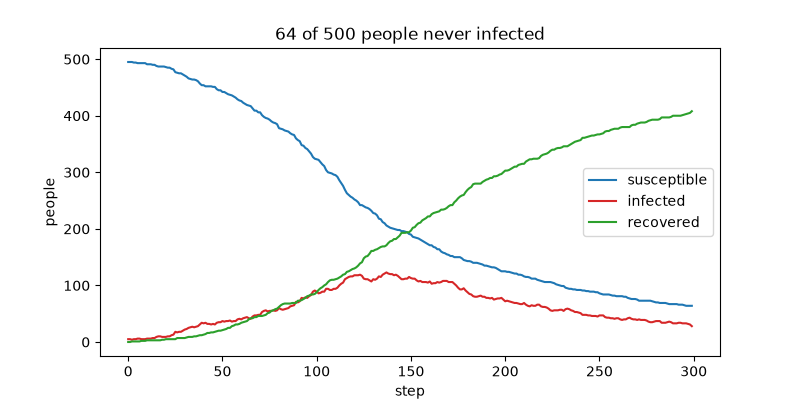
Five hundred people walk on a grid and infect those who share their cell. The epidemic grows, peaks, and burns out like the SIR equations predict, but walking limits the contacts, so the outbreak is slower and smaller than for a well-mixed population.
The model is created by name from the catalog with five infected among 500 people on a 50 by 50 grid. The observer saves every step with the default blueprint, whose primary view shows the people on the grid.
import matplotlib.pyplot as plt
import numpy as np

from skcomplex.engine.runtime import Simulation
from skcomplex.engine.viz import RerunObserver
from skcomplex.models import create

MODEL = 'agent_based_sir'

system = create(MODEL, people=500, infected=5, beta=0.6, gamma=0.02, random_state=0)
observer = RerunObserver(MODEL, save_path=f'{MODEL}.rrd', blueprint='default', interval=1)
simulation = Simulation(system, dt=1, observers=[observer], random_state=0).check().prepare().run(until=299)
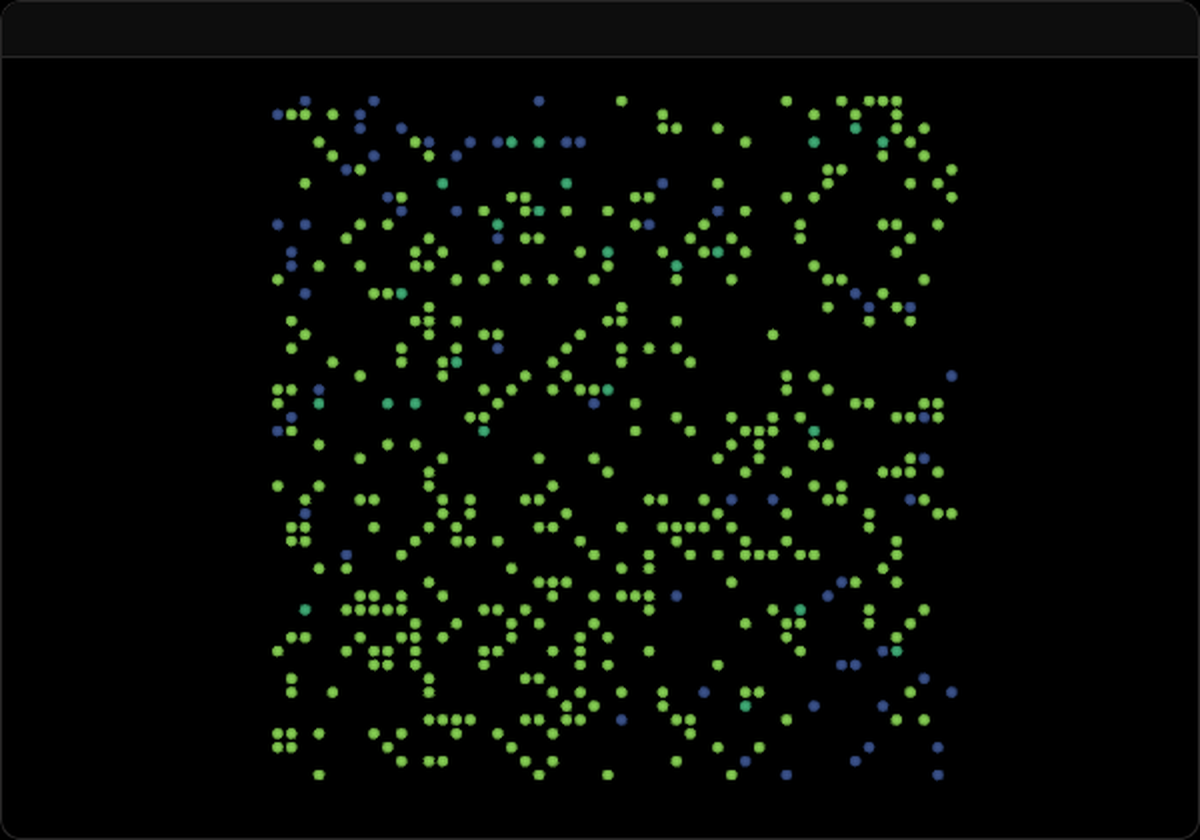
Open the recording in the Rerun viewer
Compartments over time
Counting the health states of the people at every step, the infected should rise, peak, and decline while the recovered accumulate, and part of the population should never be infected.
trajectory = simulation.trajectory_
health = np.array([trajectory.agents('people', frame).values['health'] for frame in range(len(trajectory.times))])
fig, ax = plt.subplots(figsize=(8, 4))
for value, label, color in [(0, 'susceptible', 'tab:blue'), (2, 'infected', 'tab:red'), (3, 'recovered', 'tab:green')]:
    ax.plot(trajectory.times, np.sum(health == value, axis=1), label=label, color=color)
ax.set_xlabel('step')
ax.set_ylabel('people')
ax.set_title(f'{np.sum(health[-1] == 0)} of 500 people never infected')
ax.legend()
plt.show()
About the model
People who walk on a grid and infect those in their cell, with optional extensions of the SIR model.
References
- Argun et al. 2021
- Kermack and McKendrick 1927
Total running time of the script: ( 0 minutes 5.187 seconds)
Download Python source code: plot_agent_based_sir.py