Note
Click here to download the full example code
Cyclic cellular automaton
Every cell advances to the next of 14 levels when a neighbour already holds it. From random levels, small patches first lock into local cycles, then spiral waves form around their defects and grow until they tile the whole grid.
The model is created by name from the catalog on a 128 by 128 grid with 14 levels and threshold 1, from random levels, and runs for 300 steps. The default blueprint shows the levels on the grid.
import matplotlib.pyplot as plt
import numpy as np

from skcomplex.analysis import CorrelationAnalysis
from skcomplex.engine.runtime import Simulation
from skcomplex.engine.viz import RerunObserver
from skcomplex.models import create

MODEL = 'cyclic_cellular_automaton'

system = create(MODEL, shape=(128, 128), random_state=0)
observer = RerunObserver(MODEL, save_path=f'{MODEL}.rrd', blueprint='default', interval=2)
simulation = Simulation(system, dt=1, observers=[observer]).check().prepare().run(until=300)
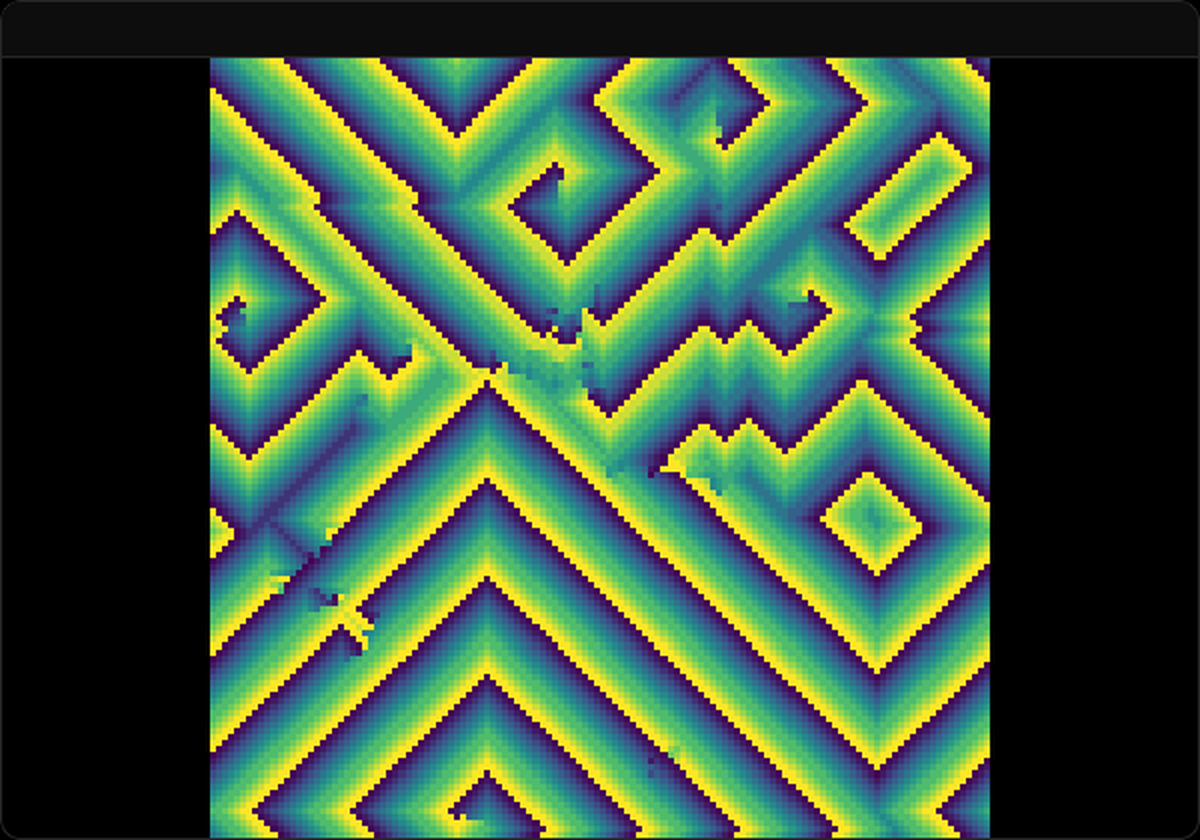
Open the recording in the Rerun viewer
Self-organization into spirals
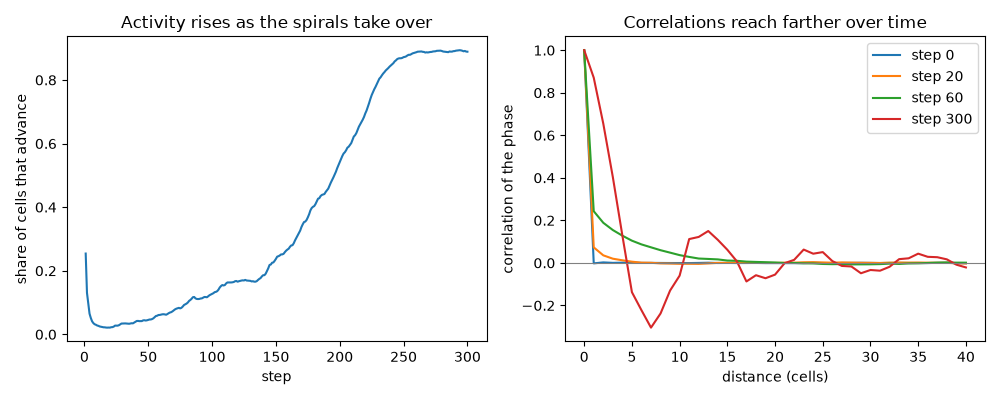
A cell advances when it changes level. In the random initial state few cells have a neighbour at the next level, and where cycles lock in every cell advances once per step until it is part of a wave, so the share of advancing cells should rise to a plateau as the spirals take over. The waves also correlate the levels over growing distances, so the spatial correlation function should decay more slowly at later steps.
levels = simulation.trajectory_.lattice('cells.level')
advancing = np.mean(levels[1:] != levels[:-1], axis=(1, 2))
fig, (activity, correlation) = plt.subplots(1, 2, figsize=(10, 4))
activity.plot(simulation.trajectory_.times[1:], advancing)
activity.set_xlabel('step')
activity.set_ylabel('share of cells that advance')
activity.set_title('Activity rises as the spirals take over')
for step in (0, 20, 60, 300):
    phase = CorrelationAnalysis('function', max_distance=40).check().prepare(np.cos(2 * np.pi * levels[step] / 14))
    phase.run()
    correlation.plot(phase.distances_, phase.correlation_, label=f'step {step}')
correlation.axhline(0.0, color='gray', linewidth=0.8)
correlation.set_xlabel('distance (cells)')
correlation.set_ylabel('correlation of the phase')
correlation.set_title('Correlations reach farther over time')
correlation.legend()
fig.tight_layout()
plt.show()
Download Python source code: plot_cyclic_cellular_automaton.py
Download Jupyter notebook: plot_cyclic_cellular_automaton.ipynb
Gallery generated by mkdocs-gallery
About the model
Griffeath's cyclic cellular automaton, whose random levels organize into spiral waves.
References
- Griffeath 1988
- Fisch, Gravner, and Griffeath 1991
- Dilão 2023