Note
Click here to download the full example code
Fishery capital
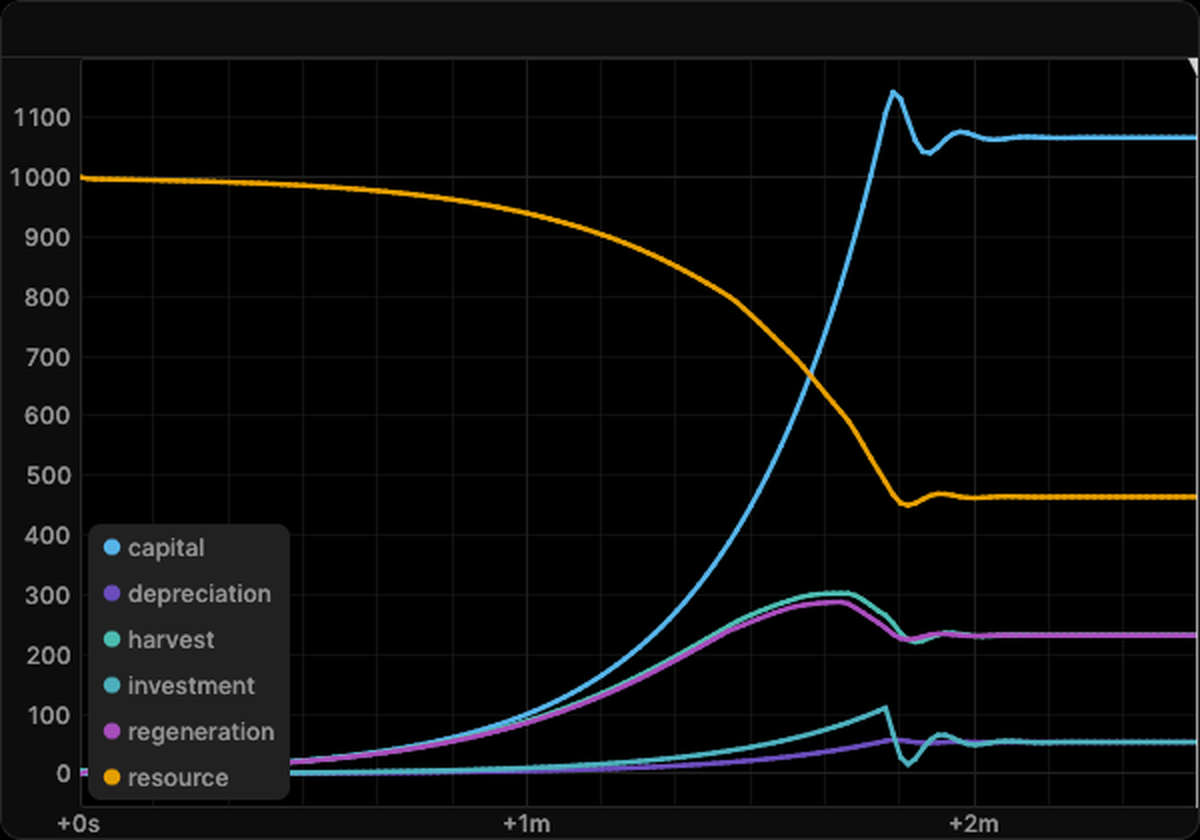
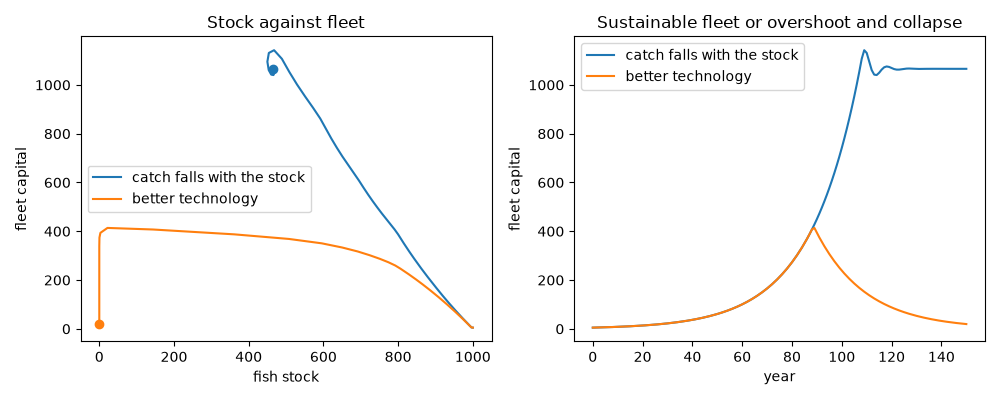
Meadows' fishing fleet: the fleet grows on the profit of its catch, and the fish regenerate fastest at intermediate stocks. When the catch per boat falls steeply as fish get scarce, the fleet and the stock settle into a sustainable equilibrium. Better fishing technology, which keeps the catch high at low stocks, lets the fleet overshoot, and the fish and then the fleet collapse.
The fleet starts with five units of capital on a stock of 1000 fish, the catch per unit of capital falls with the square of the stock, and the fleet reinvests up to 10 percent a year. The blueprint shows the stock and the fleet approaching their equilibrium after damped oscillations.
import matplotlib.pyplot as plt

from skcomplex.engine.runtime import Simulation
from skcomplex.engine.viz import RerunObserver
from skcomplex.models import create

MODEL = 'fishery_capital'
UNTIL = 150.0
TECHNOLOGY = (0.0, 0.5, 0.8, 0.9, 0.95, 1.0, 1.0, 1.0, 1.0, 1.0, 1.0)

observer = RerunObserver(MODEL, save_path=f'{MODEL}.rrd', blueprint='default', interval=1)
simulation = Simulation(create(MODEL), dt=1.0, observers=[observer]).check().prepare().run(until=UNTIL)
Open the recording in the Rerun viewer
Equilibrium or overshoot
In the stock-fleet plane, the default yield should spiral into a fixed point where regeneration equals the catch and the profit just replaces depreciation. With the yield table of better technology, which halves the catch only when almost no fish are left, the fleet should keep investing as the stock falls and drive both towards zero.
improved = Simulation(create(MODEL, yield_table=TECHNOLOGY), dt=1.0).check().prepare().run(until=UNTIL).trajectory_
runs = {'catch falls with the stock': simulation.trajectory_, 'better technology': improved}
fig, (plane, fleet) = plt.subplots(1, 2, figsize=(10, 4))
for index, (name, trajectory) in enumerate(runs.items()):
    resource, capital = trajectory.values('fishery.resource'), trajectory.values('fishery.capital')
    plane.plot(resource, capital, color=f'C{index}', label=name)
    plane.plot(resource[-1], capital[-1], 'o', color=f'C{index}')
    fleet.plot(trajectory.times, capital, color=f'C{index}', label=name)
plane.set_xlabel('fish stock')
plane.set_ylabel('fleet capital')
plane.set_title('Stock against fleet')
plane.legend()
fleet.set_xlabel('year')
fleet.set_ylabel('fleet capital')
fleet.set_title('Sustainable fleet or overshoot and collapse')
fleet.legend()
fig.tight_layout()
plt.show()
About the model
Meadows' fishing fleet, capital that grows on a renewable resource and can overshoot it.
References
- Meadows 2008
Total running time of the script: ( 0 minutes 5.065 seconds)
Download Python source code: plot_fishery_capital.py