Note
Click here to download the full example code
Mirollo-Strogatz
Fireflies that flash when charged and nudge the others at every flash end up flashing in unison: each flash pushes the nearly charged oscillators over the threshold, they join the group that fired, and the groups merge until one remains.
Five oscillators charge as x' = S - gamma x from random levels and fire at 1, kicking the others up by
ε = 0.1. The default blueprint shows the five charges, whose sawtooth curves merge one by one into a single tooth.
import matplotlib.pyplot as plt
import numpy as np

from skcomplex.engine.runtime import Simulation
from skcomplex.engine.viz import RerunObserver
from skcomplex.models import create

MODEL = 'mirollo_strogatz'

system = create(MODEL, n_oscillators=5, S=2.0, gamma=1.0, epsilon=0.1, seed=0)
observer = RerunObserver(MODEL, save_path=f'{MODEL}.rrd', blueprint='default', interval=1)
simulation = Simulation(system, dt=0.1, observers=[observer]).check().prepare().run(until=20)
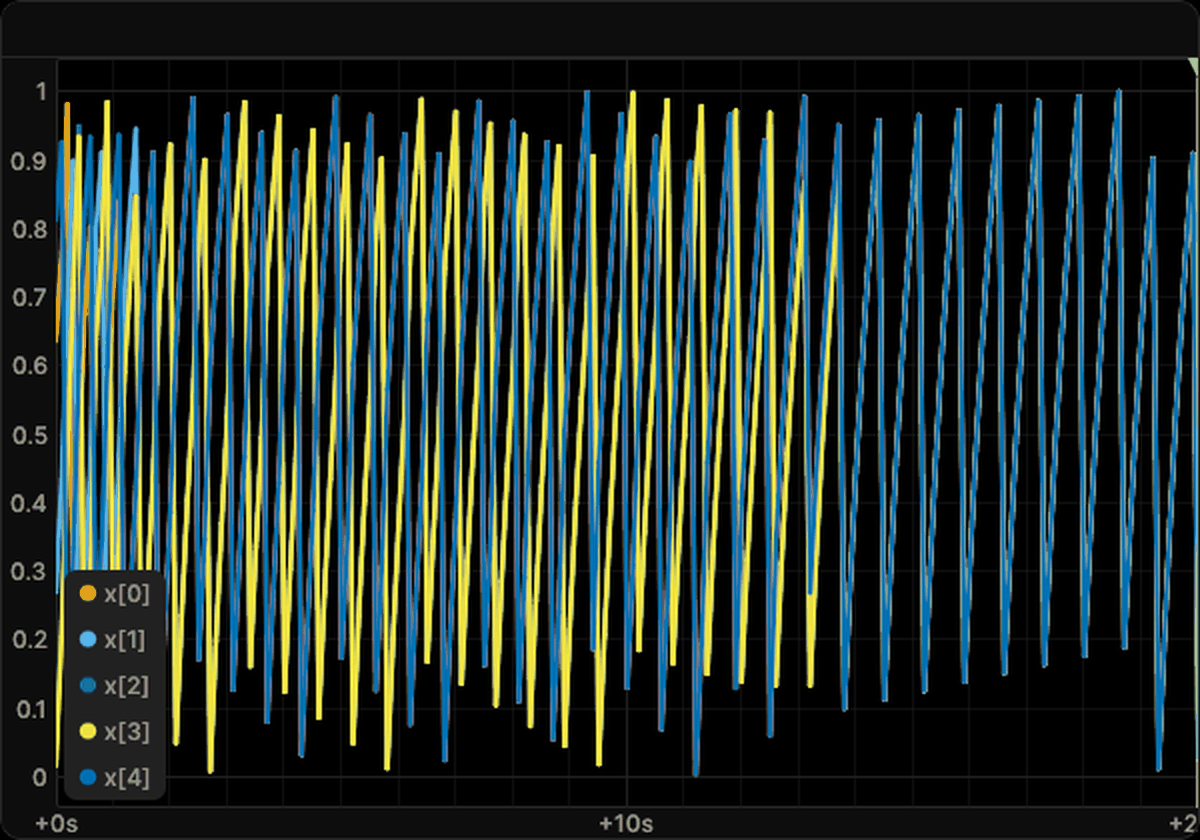
Open the recording in the Rerun viewer
Absorption into ever fewer groups
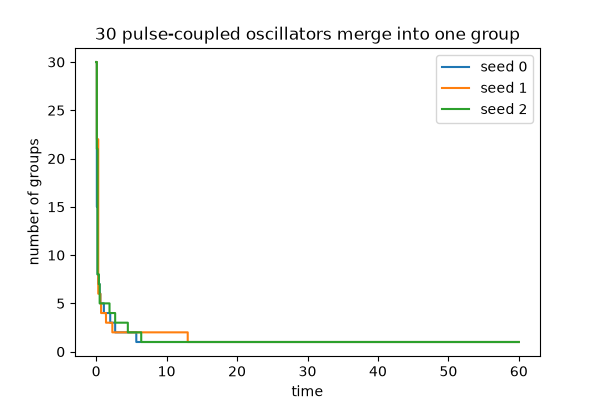
Oscillators that fire together keep equal charges forever, so the number of distinct charges counts the groups. For a larger population the count should only ever fall, step by step at absorptions, down to one group firing in sync.
fig, ax = plt.subplots(figsize=(6, 4))
for seed in range(3):
    run = Simulation(create(MODEL, n_oscillators=30, epsilon=0.1, seed=seed), dt=0.1).check().prepare().run(until=60)
    charges = np.asarray(run.trajectory_.values('oscillators.x'))
    groups = [len(np.unique(np.round(frame, 6))) for frame in charges]
    ax.step(run.trajectory_.times, groups, where='post', label=f'seed {seed}')
ax.set_xlabel('time')
ax.set_ylabel('number of groups')
ax.set_title('30 pulse-coupled oscillators merge into one group')
ax.legend()
plt.show()
About the model
Integrate-and-fire oscillators coupled by pulses, which end up firing in unison.
References
- Mirollo and Strogatz 1990
- Arenas et al. 2008
Total running time of the script: ( 0 minutes 1.962 seconds)
Download Python source code: plot_mirollo_strogatz.py