Note
Click here to download the full example code
NBA basketball
This example shows NBAStats, the free NBA statistics that ESPN publishes.
# Author: Georgios Douzas <gdouzas@icloud.com>
# Licence: MIT

import matplotlib.pyplot as plt

from sportsbet.dataloaders import DataLoader
from sportsbet.sources import EuroLeagueStats, NBAStats
A league is a source, not a dataloader
The NBA is the same sport as the EuroLeague. So it uses the same dataloader with different statistics.
stats = NBAStats()
stats.name, stats.kind, stats.sport
Out:
('nba', 'stats', 'basketball')
{'same sport as the EuroLeague': NBAStats().sport == EuroLeagueStats().sport}
Out:
{'same sport as the EuroLeague': True}
A season is named by the year it ends in, so 2026 is the 2025-26 season. It carries the regular season, the play-in and the play-offs. It never carries the pre-season or the all-star weekend, whose teams are not clubs.
params = stats.list_available_params()
sorted({param['year'] for param in params})[-5:]
Out:
[2023, 2024, 2025, 2026, 2027]
It is live. The games played this week carry their scores this week. That is what makes the current season bettable rather than only reviewable. The NBA's own official archive publishes a season's results only months after the season ends. A source built on that archive could backtest the league but never bet on it.
Extracting the data
It is free and needs no key. The odds are another source, and there is no free one for basketball. With statistics
alone, extract_exploration_data returns the features on their own.
dataloader = DataLoader(param_grid={'league': ['NBA'], 'year': [2024]}, stats=stats)
X = dataloader.extract_exploration_data()
X
Out:
                          league  division  ...  home_wins_avg home_wins_latest_avg
date                                        ...
2023-10-24 23:30:00+00:00    NBA         1  ...            NaN                  NaN
2023-10-25 02:00:00+00:00    NBA         1  ...            NaN                  NaN
2023-10-25 23:00:00+00:00    NBA         1  ...            NaN                  NaN
2023-10-25 23:00:00+00:00    NBA         1  ...            NaN                  NaN
2023-10-25 23:00:00+00:00    NBA         1  ...            NaN                  NaN
...                          ...       ...  ...            ...                  ...
2024-06-07 00:30:00+00:00    NBA         1  ...       0.791667             1.000000
2024-06-10 00:00:00+00:00    NBA         1  ...       0.793814             1.000000
2024-06-13 00:30:00+00:00    NBA         1  ...       0.613861             0.333333
2024-06-15 00:30:00+00:00    NBA         1  ...       0.607843             0.000000
2024-06-18 00:30:00+00:00    NBA         1  ...       0.790000             0.666667

[1319 rows x 17 columns]
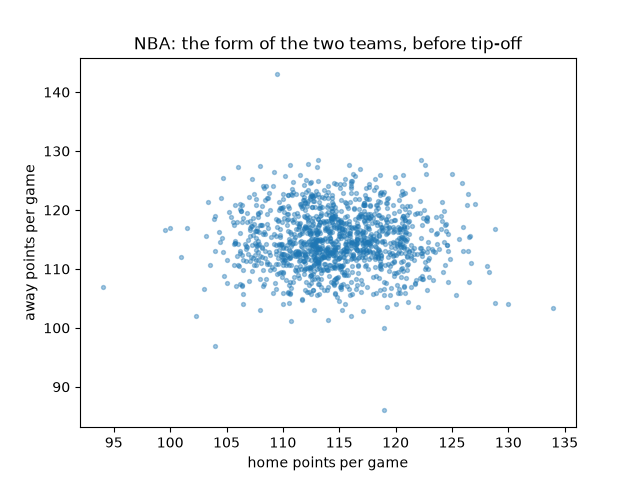
A picture of it
fig, ax = plt.subplots()
ax.scatter(X['home_points_for_avg'], X['away_points_for_avg'], s=8, alpha=0.4)
ax.set_title('NBA: the form of the two teams, before tip-off')
ax.set_xlabel('home points per game')
ax.set_ylabel('away points per game')
Out:
Text(37.722222222222214, 0.5, 'away points per game')
Total running time of the script: ( 0 minutes 3.875 seconds)
Download Python source code: plot_nba.py