Note
Click here to download the full example code
Classifier bettor
This example shows ClassifierBettor. It wraps any scikit-learn classifier and turns its probabilities into bets.
# Author: Georgios Douzas <gdouzas@icloud.com>
# Licence: MIT

import matplotlib.pyplot as plt
from sklearn.impute import SimpleImputer
from sklearn.model_selection import TimeSeriesSplit, cross_val_score
from sklearn.neighbors import KNeighborsClassifier
from sklearn.pipeline import make_pipeline

from sportsbet.dataloaders import DataLoader
from sportsbet.evaluation import ClassifierBettor, backtest
from sportsbet.sources import FootballDataOdds, FootballDataStats
The data
This is three seasons of the Spanish league. Dropping the columns that are more than half empty keeps the classifier simple. The market maximum odds are the most generous price on offer for each outcome.
dataloader = DataLoader(
    param_grid={'league': ['Spain'], 'year': [2020, 2021, 2022]},
    stats=FootballDataStats(),
    odds=FootballDataOdds(),
)
X_train, Y_train, O_train = dataloader.extract_train_data(drop_na_thres=0.5, odds_type='market_maximum')
The targets are the three outcomes, one boolean column each:
Y_train
Out:
                           home_win__postplay__0min  ...  under_2.5__postplay__0min
date                                                 ...
2019-08-16 19:00:00+00:00                       1.0  ...                        1.0
2019-08-17 15:00:00+00:00                       0.0  ...                        0.0
2019-08-17 16:00:00+00:00                       0.0  ...                        1.0
2019-08-17 16:00:00+00:00                       0.0  ...                        1.0
2019-08-17 17:00:00+00:00                       0.0  ...                        1.0
...                                             ...  ...                        ...
2022-05-29 18:00:00+00:00                       0.0  ...                        0.0
2022-05-29 18:00:00+00:00                       1.0  ...                        0.0
2022-05-29 18:00:00+00:00                       0.0  ...                        1.0
2022-05-29 18:00:00+00:00                       0.0  ...                        0.0
2022-05-29 18:00:00+00:00                       1.0  ...                        0.0

[2526 rows x 5 columns]
A KNN classifier understands only numbers. Keep the numerical columns and let an imputer fill the gaps.
num_cols = X_train.columns[['float' in col_type.name for col_type in X_train.dtypes]]
X_train = X_train[num_cols]
The bettor
A bettor is a classifier. It has fit, predict and predict_proba. So the pipeline goes straight in, and the
usual scikit-learn tooling works on it. Here is its cross-validated accuracy:
bettor = ClassifierBettor(make_pipeline(SimpleImputer(), KNeighborsClassifier()))
cross_val_score(bettor, X_train, Y_train, cv=TimeSeriesSplit(), scoring='accuracy').mean()
Out:
np.float64(0.14679334916864606)
Backtesting
Accuracy is not money. The backtest walks the seasons in order. It bets only where the model sees value. It reports what the bankroll did.
bettor.fit(X_train, Y_train)
backtesting_results = backtest(bettor, X_train, Y_train, O_train)
backtesting_results
Out:
                                                       Number of betting days  ...  Yield percentage per bet (under_2.5)
Training start Training end Testing start Testing end                          ...
2019-08-16     2020-01-04   2020-01-04    2020-08-07                      246  ...                                  -0.4
               2020-08-07   2020-09-12    2021-01-23                      302  ...                                  12.7
               2021-01-23   2021-01-23    2021-05-30                      308  ...                                   1.8
               2021-05-30   2021-08-13    2022-01-02                      295  ...                                   1.4
               2022-01-02   2022-01-02    2022-05-29                      289  ...                                  -1.2

[5 rows x 15 columns]
The value bets for the upcoming matches come from the same fitted model:
X_fix, _, Odds_fix = dataloader.extract_fixtures_data()
X_fix = X_fix[num_cols]
assert Odds_fix is not None
_ = bettor.bet(X_fix, Odds_fix)
Where the bets come from
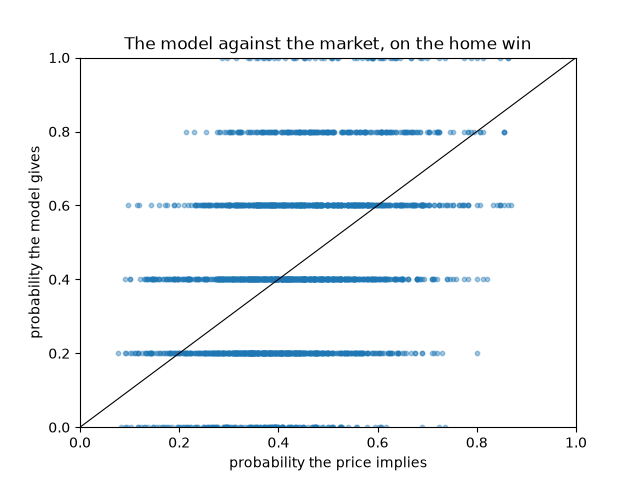
The bettor places a bet when the model thinks an outcome is likelier than its price implies. The chart below sets each match's home-win probability from the model against the probability the odds imply. Everything above the diagonal is where the model disagrees with the market in your favour. Those points are the bets. The backtest above tells you whether they were wisdom or noise.
home_win_col = next(col for col in O_train.columns if '__home_win__' in col)
markets = bettor.betting_markets_.tolist()
model_prob = bettor.predict_proba(X_train)[:, markets.index('home_win')]
implied_prob = 1 / O_train[home_win_col].to_numpy()

fig, ax = plt.subplots()
ax.scatter(implied_prob, model_prob, s=10, alpha=0.4)
ax.plot([0, 1], [0, 1], color='black', linewidth=0.8)
ax.set_title('The model against the market, on the home win')
ax.set_xlabel('probability the price implies')
ax.set_ylabel('probability the model gives')
ax.set_xlim(0, 1)
ax.set_ylim(0, 1)
Out:
(0.0, 1.0)
Total running time of the script: ( 0 minutes 18.696 seconds)
Download Python source code: plot_classifier_bettor.py