Note
Click here to download the full example code
A bettor of your own
This example shows BaseBettor and derive_complementary_events.
# Author: Georgios Douzas <gdouzas@icloud.com>
# Licence: MIT

import matplotlib.pyplot as plt
import numpy as np
from sklearn.model_selection import TimeSeriesSplit

from sportsbet.dataloaders import DataLoader
from sportsbet.evaluation import BaseBettor, backtest, derive_complementary_events
from sportsbet.sources import SampleSoccerOdds, SampleSoccerStats
Two methods to implement
A bettor turns probabilities into bets. Implement _fit and _predict_proba, and the value bets, the backtest and
the bankroll all follow. The bettor places a bet when the probability your model gives an outcome is higher than the
probability the price implies.
class BaseRateBettor(BaseBettor):
    """A bettor that knows only how often each outcome has happened."""

    def _fit(self, X, Y, O):
        # `Y` carries the markets it was told to bet, in the order it was told them.
        self.rates_ = Y.mean().to_numpy()
        return self

    def _predict_proba(self, X):
        rates = np.tile(self.rates_, (len(X), 1))
        return rates / rates.sum(axis=1, keepdims=True)
Extracting the data
dataloader = DataLoader(
    param_grid={'league': ['England']},
    stats=SampleSoccerStats(),
    odds=SampleSoccerOdds(),
)
X_train, Y_train, O_train = dataloader.extract_train_data(odds_type='market_average')
Betting with it
bettor = BaseRateBettor(betting_markets=['home_win', 'draw', 'away_win'])
_ = bettor.fit(X_train, Y_train, O_train)
bettor.predict_proba(X_train)
Out:
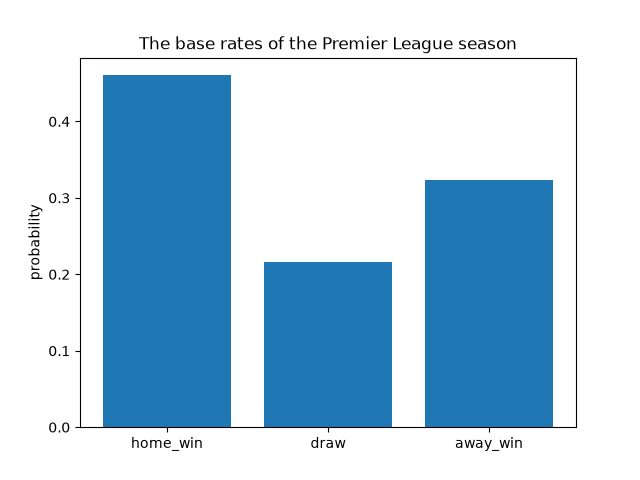
array([[0.46052632, 0.21578947, 0.32368421],
       [0.46052632, 0.21578947, 0.32368421],
       [0.46052632, 0.21578947, 0.32368421],
       ...,
       [0.46052632, 0.21578947, 0.32368421],
       [0.46052632, 0.21578947, 0.32368421],
       [0.46052632, 0.21578947, 0.32368421]], shape=(380, 3))
backtest(bettor, X_train, Y_train, O_train, cv=TimeSeriesSplit(3))
Out:
                                                       Number of betting days  ...  Yield percentage per bet (away_win)
Training start Training end Testing start Testing end                          ...
2023-08-11     2023-10-28   2023-10-29    2023-12-30                       57  ...                                  1.7
               2023-12-30   2023-12-30    2024-03-30                       66  ...                                -36.2
               2024-03-30   2024-03-30    2024-05-19                       56  ...                                -41.9

[3 rows x 11 columns]
Which markets are mutually exclusive
The probabilities of a group of complementary markets must sum to one. The groups come from the data, not from a list somebody wrote down. A sport that cannot be drawn has two outcomes instead of three, and nothing had to be told which sport this is.
derive_complementary_events(['home_win', 'draw', 'away_win', 'over_2.5', 'under_2.5'])
Out:
[['home_win', 'draw', 'away_win'], ['over_2.5', 'under_2.5']]
derive_complementary_events(['home_win', 'away_win'])
Out:
[['home_win', 'away_win']]
A picture of it
markets = bettor.betting_markets_.tolist()

fig, ax = plt.subplots()
ax.bar(markets, bettor.predict_proba(X_train)[0])
ax.set_title('The base rates of the Premier League season')
ax.set_ylabel('probability')
Out:
Text(42.722222222222214, 0.5, 'probability')
Total running time of the script: ( 0 minutes 1.780 seconds)
Download Python source code: plot_custom_bettor.py