Note
Click here to download the full example code
Saving and loading a dataloader
This example shows save and load_dataloader.
# Author: Georgios Douzas <gdouzas@icloud.com>
# Licence: MIT

import tempfile
from pathlib import Path

import matplotlib.pyplot as plt

from sportsbet.dataloaders import DataLoader, load_dataloader
from sportsbet.sources import SampleSoccerOdds, SampleSoccerStats
A dataloader remembers what it was told
The columns of the fixtures data are the columns of the training data. A dataloader that has extracted once carries that shape with it. Saving it keeps the shape. So you can extract the training data on one machine and predict on another.
dataloader = DataLoader(
    param_grid={'league': ['England']},
    stats=SampleSoccerStats(),
    odds=SampleSoccerOdds(),
)
X_train, Y_train, O_train = dataloader.extract_train_data(odds_type='market_average')

path = str(Path(tempfile.mkdtemp()) / 'dataloader.pkl')
_ = dataloader.save(path)
It comes back knowing its selection and its columns.
loaded = load_dataloader(path)
{'same selection': loaded.param_grid_ == dataloader.param_grid_}
Out:
{'same selection': True}
X_fix, _, O_fix = loaded.extract_fixtures_data()
{'same columns': list(X_fix.columns) == list(X_train.columns)}
Out:
{'same columns': True}
A picture of it
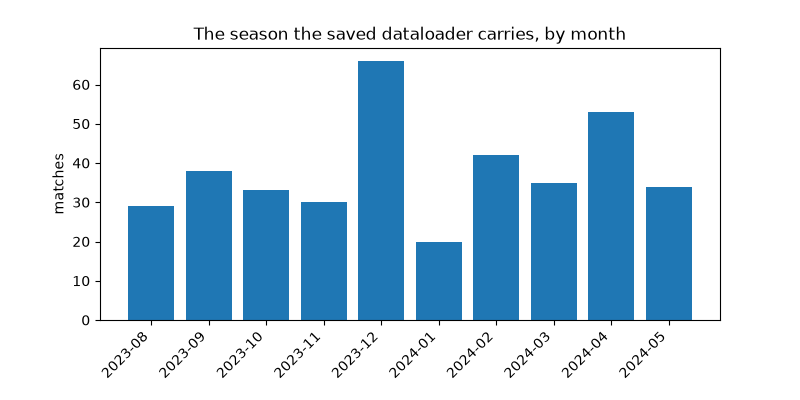
The saved file holds the whole season. It has every match the loader extracted, ready to travel to another machine. Here it is by month.
per_month = X_train.index.to_period('M').value_counts().sort_index()

fig, ax = plt.subplots(figsize=(8, 4))
ax.bar([str(period) for period in per_month.index], per_month.to_numpy())
ax.set_title('The season the saved dataloader carries, by month')
ax.set_ylabel('matches')
fig.autofmt_xdate(rotation=45)
Out:
/home/runner/work/sports-betting/sports-betting/docs/examples/dataloaders/plot_save_load.py:54: UserWarning: Converting to PeriodArray/Index representation will drop timezone information.
  per_month = X_train.index.to_period('M').value_counts().sort_index()
Total running time of the script: ( 0 minutes 0.785 seconds)
Download Python source code: plot_save_load.py