Note
Click here to download the full example code
A dataloader of your own
This example shows BaseDataLoader. Use it for data that is already on your machine and never came from a source.
# Author: Georgios Douzas <gdouzas@icloud.com>
# Licence: MIT

import matplotlib.pyplot as plt
import pandas as pd

from sportsbet.dataloaders import BaseDataLoader
from sportsbet.sources import derive_market_outcomes
One method to implement
A dataloader reads long snapshots and shapes them. The only thing it does not know is where they come from. So that is
the only thing you tell it. Implement _load_snapshots and everything else follows.
MATCHES = [('2024-08-16', 'Arsenal', 'Chelsea', 2, 0), ('2024-08-23', 'Everton', 'Spurs', 1, 2)]
MARKETS = ['home_win', 'draw', 'away_win']


class MyDataLoader(BaseDataLoader):
    """A dataloader of snapshots I already hold."""

    def _load_snapshots(self):
        stats, odds = [], []
        for date, home, away, home_goals, away_goals in MATCHES:
            identity = {
                'date': date,
                'league': 'England',
                'division': 1,
                'year': 2025,
                'home_team': home,
                'away_team': away,
            }
            outcomes = derive_market_outcomes(pd.Series([home_goals]), pd.Series([away_goals]), MARKETS).iloc[0]
            stats += [
                {**identity, 'event_status': 'preplay', 'event_time': pd.Timedelta('0min'), 'home_points_avg': 2.1},
                {**identity, 'event_status': 'postplay', 'event_time': pd.Timedelta('0min'), **outcomes},
            ]
            odds.append(
                dict(
                    **identity,
                    event_status='preplay',
                    event_time=pd.Timedelta('0min'),
                    provider='acme',
                    home_win=1.7,
                    draw=3.6,
                    away_win=4.8,
                ),
            )
        return pd.DataFrame(stats), pd.DataFrame(odds)
Nothing is downloaded, because there is nothing to download.
dataloader = MyDataLoader()
dataloader.get_odds_types()
Out:
['acme']
The dataloader derives the providers, the markets, the features and the moments from the data. Nothing was registered.
X, Y, O = dataloader.extract_train_data(odds_type='acme')
X
Out:
                            league  division  ...  away_team home_points_avg
date                                          ...
2024-08-16 00:00:00+00:00  England         1  ...    Chelsea             2.1
2024-08-23 00:00:00+00:00  England         1  ...      Spurs             2.1

[2 rows x 6 columns]
Y
Out:
                           home_win__postplay__0min  ...  away_win__postplay__0min
date                                                 ...
2024-08-16 00:00:00+00:00                       1.0  ...                       0.0
2024-08-23 00:00:00+00:00                       0.0  ...                       1.0

[2 rows x 3 columns]
O
Out:
                           acme__away_win__preplay__0min  ...  acme__home_win__preplay__0min
date                                                      ...
2024-08-16 00:00:00+00:00                            4.8  ...                            1.7
2024-08-23 00:00:00+00:00                            4.8  ...                            1.7

[2 rows x 3 columns]
A picture of it
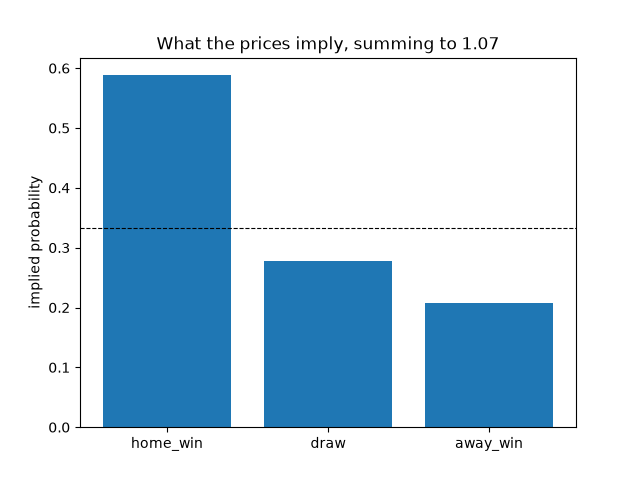
The odds my feed carries imply a probability for each outcome. The probabilities sum to more than one. That surplus is the bookmaker's margin. It is built into every price, and it is why a naive bet loses slowly.
prices = {market: O.filter(like=f'__{market}__').iloc[0, 0] for market in MARKETS}
implied = {market: 1 / price for market, price in prices.items()}
overround = sum(implied.values())

fig, ax = plt.subplots()
ax.bar(list(implied), list(implied.values()))
ax.axhline(1 / len(MARKETS), color='black', linewidth=0.8, linestyle='--')
ax.set_title(f'What the prices imply, summing to {overround:.2f}')
ax.set_ylabel('implied probability')
Out:
Text(42.722222222222214, 0.5, 'implied probability')
Total running time of the script: ( 0 minutes 0.297 seconds)
Download Python source code: plot_custom_dataloader.py