Note
Click here to download the full example code
Football Data soccer feed
This example shows FootballDataStats and FootballDataOdds, the free soccer feed from football-data.co.uk.
# Author: Georgios Douzas <gdouzas@icloud.com>
# Licence: MIT

import matplotlib.pyplot as plt
import pandas as pd

from sportsbet.dataloaders import DataLoader
from sportsbet.sources import FootballDataOdds, FootballDataStats
Asking the source what exists
You cannot write a parameter grid before you know what exists. So you ask the source, not a dataloader.
stats = FootballDataStats()
params = stats.list_available_params()
len(params)
Out:
920
The leagues it publishes:
sorted({param['league'] for param in params})
Out:
['Argentina', 'Austria', 'Belgium', 'Brazil', 'China', 'Denmark', 'England', 'Finland', 'France', 'Germany', 'Greece', 'Ireland', 'Italy', 'Japan', 'Mexico', 'Netherlands', 'Norway', 'Poland', 'Portugal', 'Romania', 'Russia', 'Scotland', 'Spain', 'Sweden', 'Switzerland', 'Turkey', 'USA']
It is free. It is the only feed in the library that gives both statistics and odds for nothing. The odds are the closing prices offered before kick-off.
odds = FootballDataOdds()
odds.name, odds.kind, odds.sport
Out:
('football_data', 'odds', 'soccer')
Extracting the data
Both sources read the same upstream files. They declare the same items, so the dataloader downloads each file once, not twice.
dataloader = DataLoader(
    param_grid={'league': ['Spain'], 'division': [1], 'year': [2024]},
    stats=stats,
    odds=odds,
)
X_train, Y_train, O_train = dataloader.extract_train_data(odds_type='market_maximum')
The input data:
X_train
Out:
                          league  ...  home_points_latest_avg
date                              ...
2023-08-11 17:30:00+00:00  Spain  ...                     NaN
2023-08-11 20:00:00+00:00  Spain  ...                     NaN
2023-08-12 15:00:00+00:00  Spain  ...                     NaN
2023-08-12 17:30:00+00:00  Spain  ...                     NaN
2023-08-12 19:30:00+00:00  Spain  ...                     NaN
...                          ...  ...                     ...
2024-05-25 19:00:00+00:00  Spain  ...                2.333333
2024-05-26 12:00:00+00:00  Spain  ...                0.000000
2024-05-26 14:15:00+00:00  Spain  ...                2.000000
2024-05-26 14:15:00+00:00  Spain  ...                0.666667
2024-05-26 19:00:00+00:00  Spain  ...                0.000000

[380 rows x 29 columns]
The available odds types are the providers the data carries:
dataloader.get_odds_types()
Out:
['market_average', 'market_maximum']
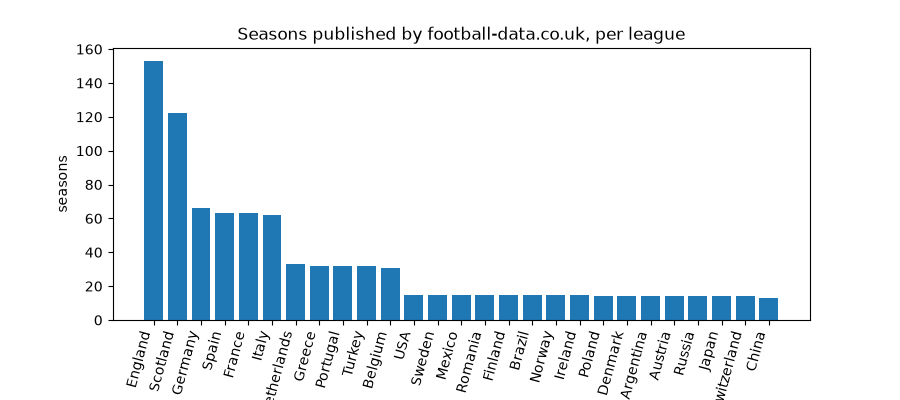
A picture of it
coverage = pd.DataFrame(params).groupby('league').size().sort_values(ascending=False)

fig, ax = plt.subplots(figsize=(9, 4))
ax.bar(coverage.index, coverage.to_numpy())
ax.set_title('Seasons published by football-data.co.uk, per league')
ax.set_ylabel('seasons')
fig.autofmt_xdate(rotation=75)
Total running time of the script: ( 0 minutes 8.954 seconds)
Download Python source code: plot_football_data.py