Note
Click here to download the full example code
Dataloader
This example shows DataLoader. It turns the data of your sources into training and fixtures data.
# Author: Georgios Douzas <gdouzas@icloud.com>
# Licence: MIT

import matplotlib.pyplot as plt

from sportsbet.dataloaders import DataLoader
from sportsbet.sources import SampleSoccerOdds, SampleSoccerStats
There is one dataloader
There is not one dataloader per sport. The sport is a property of the sources, so you never tell the dataloader what it is looking at. You choose the sources, so you always know where your data came from.
dataloader = DataLoader(
    param_grid={'league': ['England'], 'division': [1], 'year': [2024]},
    stats=SampleSoccerStats(),
    odds=SampleSoccerOdds(),
)
dataloader.sport_
Out:
'soccer'
Selecting the data
param_grid selects what to train on. Any dimension you leave out takes all of its available values. The dataloader
never requests a combination the sources do not publish.
dataloader.sources_
Out:
(<sportsbet.sources._stats._sample.SampleSoccerStats object at 0x7f3d7f9f4050>, <sportsbet.sources._odds._sample.SampleSoccerOdds object at 0x7f3d7f9f42f0>)
The available odds types are the providers the data carries. The dataloader reads them from the data rather than from a registry.
dataloader.get_odds_types()
Out:
['market_average', 'market_maximum']
Extracting the training data
This is where the download happens. It pulls the selected seasons and returns three frames. The dataloader keeps
them. So once you have extracted, save carries the data with it and nothing has to be fetched twice.
X_train, Y_train, O_train = dataloader.extract_train_data(odds_type='market_average')
The input data:
X_train
Out:
                            league  division  ...  away_points_avg home_points_avg
date                                          ...
2023-08-11 19:00:00+00:00  England         1  ...              NaN             NaN
2023-08-12 11:30:00+00:00  England         1  ...              NaN             NaN
2023-08-12 14:00:00+00:00  England         1  ...              NaN             NaN
2023-08-12 14:00:00+00:00  England         1  ...              NaN             NaN
2023-08-12 14:00:00+00:00  England         1  ...              NaN             NaN
...                            ...       ...  ...              ...             ...
2024-05-19 15:00:00+00:00  England         1  ...         1.837838        1.243243
2024-05-19 15:00:00+00:00  England         1  ...         1.243243        2.135135
2024-05-19 15:00:00+00:00  England         1  ...         1.189189        0.702703
2024-05-19 15:00:00+00:00  England         1  ...         1.405405        2.378378
2024-05-19 15:00:00+00:00  England         1  ...         1.702703        0.432432

[380 rows x 7 columns]
The multi-output targets:
Y_train
Out:
                           home_win__postplay__0min  ...  under_2.5__postplay__0min
date                                                 ...
2023-08-11 19:00:00+00:00                       0.0  ...                        0.0
2023-08-12 11:30:00+00:00                       1.0  ...                        0.0
2023-08-12 14:00:00+00:00                       0.0  ...                        1.0
2023-08-12 14:00:00+00:00                       1.0  ...                        0.0
2023-08-12 14:00:00+00:00                       0.0  ...                        1.0
...                                             ...  ...                        ...
2024-05-19 15:00:00+00:00                       1.0  ...                        0.0
2024-05-19 15:00:00+00:00                       1.0  ...                        1.0
2024-05-19 15:00:00+00:00                       0.0  ...                        0.0
2024-05-19 15:00:00+00:00                       1.0  ...                        0.0
2024-05-19 15:00:00+00:00                       0.0  ...                        0.0

[380 rows x 5 columns]
The odds:
O_train
Out:
                           market_average__away_win__preplay__0min  ...  market_average__under_2.5__preplay__0min
date                                                                ...
2023-08-11 19:00:00+00:00                                     1.35  ...                                      2.27
2023-08-12 11:30:00+00:00                                    15.67  ...                                      2.85
2023-08-12 14:00:00+00:00                                     2.64  ...                                      1.94
2023-08-12 14:00:00+00:00                                     9.61  ...                                      2.34
2023-08-12 14:00:00+00:00                                     3.30  ...                                      1.86
...                                                            ...  ...                                       ...
2024-05-19 15:00:00+00:00                                     3.67  ...                                      2.96
2024-05-19 15:00:00+00:00                                    14.55  ...                                      4.23
2024-05-19 15:00:00+00:00                                     2.23  ...                                      2.76
2024-05-19 15:00:00+00:00                                    21.81  ...                                      4.45
2024-05-19 15:00:00+00:00                                     1.35  ...                                      4.14

[380 rows x 5 columns]
Extracting the fixtures data
A fixture is a match that has not been played. param_grid selects what to train on, and it does not restrict the
fixtures. A match you could have trained on has already been played. So you may train on England and bet on Italy. The
two frames share their columns, not their contents.
The sample is a finished season, so it has no fixtures. Use a live source to get some.
X_fix, Y_fix, O_fix = dataloader.extract_fixtures_data()
{'fixtures': len(X_fix), 'same columns': list(X_fix.columns) == list(X_train.columns)}
Out:
{'fixtures': 0, 'same columns': True}
There is no target for a match that has not been played:
{'no target for an unplayed match': Y_fix is None}
Out:
{'no target for an unplayed match': True}
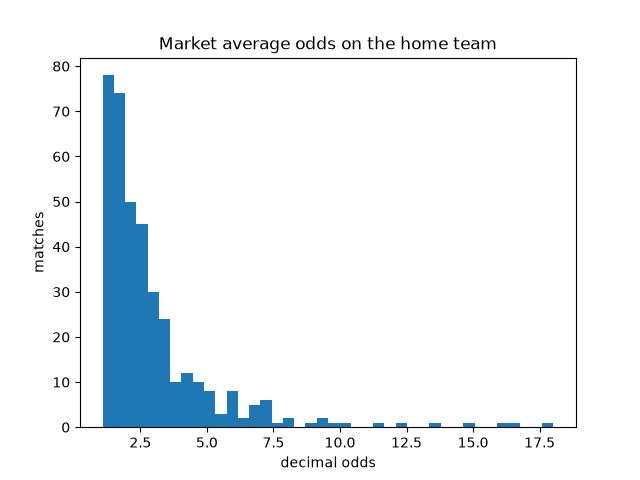
A picture of it
home_win = next(col for col in O_train.columns if '__home_win__' in col)

fig, ax = plt.subplots()
ax.hist(O_train[home_win].dropna(), bins=40)
ax.set_title('Market average odds on the home team')
ax.set_xlabel('decimal odds')
ax.set_ylabel('matches')
Out:
Text(46.722222222222214, 0.5, 'matches')
Total running time of the script: ( 0 minutes 5.504 seconds)
Download Python source code: plot_dataloader.py