Note
Click here to download the full example code
EuroLeague basketball
This example shows EuroLeagueStats, the free statistics from the EuroLeague's own API.
# Author: Georgios Douzas <gdouzas@icloud.com>
# Licence: MIT

import matplotlib.pyplot as plt

from sportsbet.dataloaders import DataLoader
from sportsbet.sources import EuroLeagueStats
A different sport, the same dataloader
The sport is a property of the source, not of the dataloader. There is one dataloader. It handles basketball here because this source is basketball.
stats = EuroLeagueStats()
stats.name, stats.kind, stats.sport
Out:
('euroleague', 'stats', 'basketball')
These are the seasons it publishes. A whole season arrives in a single request. It needs no key.
params = stats.list_available_params()
sorted({param['year'] for param in params})[-5:]
Out:
[2023, 2024, 2025, 2026, 2027]
Extracting the features
There is no free basketball odds feed, so you have to buy the odds. See OddsApi. Without odds
there are no markets and nothing to predict, so extract_train_data stops and says so. The features are still
useful, so extract_exploration_data returns them on their own.
dataloader = DataLoader(param_grid={'league': ['Euroleague'], 'year': [2024]}, stats=stats)
X = dataloader.extract_exploration_data()
The features, with no targets and no odds:
X
Out:
                               league  ...  home_wins_latest_avg
date                                   ...
2023-10-05 17:00:00+00:00  Euroleague  ...                   NaN
2023-10-05 18:05:00+00:00  Euroleague  ...                   NaN
2023-10-05 18:30:00+00:00  Euroleague  ...                   NaN
2023-10-05 18:30:00+00:00  Euroleague  ...                   NaN
2023-10-05 18:30:00+00:00  Euroleague  ...                   NaN
...                               ...  ...                   ...
2024-05-08 19:00:00+00:00  Euroleague  ...              0.666667
2024-05-24 16:00:00+00:00  Euroleague  ...              0.666667
2024-05-24 19:00:00+00:00  Euroleague  ...              1.000000
2024-05-26 15:00:00+00:00  Euroleague  ...              0.666667
2024-05-26 18:00:00+00:00  Euroleague  ...              1.000000

[331 rows x 17 columns]
The data settles two things for you, without configuration. There is no draw, because a tie goes to overtime, so the outcome is two-way. There is no totals market, because a bookmaker sets a different line for every game, and a market whose line moves is not a column.
A picture of it
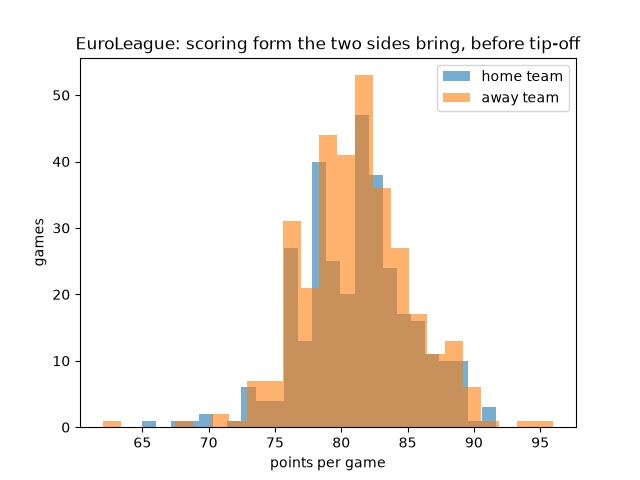
This shows the form of the two sides, side by side. The home teams sit a little to the right of the away teams. That gap is the home advantage, and it comes from the data rather than from any setting.
fig, ax = plt.subplots()
ax.hist(X['home_points_for_avg'].dropna(), bins=25, alpha=0.6, label='home team')
ax.hist(X['away_points_for_avg'].dropna(), bins=25, alpha=0.6, label='away team')
ax.set_title('EuroLeague: scoring form the two sides bring, before tip-off')
ax.set_xlabel('points per game')
ax.set_ylabel('games')
ax.legend()
Out:
<matplotlib.legend.Legend object at 0x7f3d7aad2f90>
Total running time of the script: ( 0 minutes 1.606 seconds)
Download Python source code: plot_euroleague.py