Note
Click here to download the full example code
Searching over betting markets
This example shows BettorGridSearchCV. The markets to bet on are a hyperparameter, so you can search over them like any other.
# Author: Georgios Douzas <gdouzas@icloud.com>
# Licence: MIT

import matplotlib.pyplot as plt
import pandas as pd
from sklearn.compose import make_column_transformer
from sklearn.impute import SimpleImputer
from sklearn.linear_model import LogisticRegression
from sklearn.model_selection import TimeSeriesSplit
from sklearn.multioutput import MultiOutputClassifier
from sklearn.pipeline import make_pipeline
from sklearn.preprocessing import OneHotEncoder

from sportsbet.dataloaders import DataLoader
from sportsbet.evaluation import BettorGridSearchCV, ClassifierBettor, backtest
from sportsbet.sources import SampleSoccerOdds, SampleSoccerStats
Extracting the data
dataloader = DataLoader(
    param_grid={'league': ['England', 'Spain']},
    stats=SampleSoccerStats(),
    odds=SampleSoccerOdds(),
)
X_train, Y_train, O_train = dataloader.extract_train_data(odds_type='market_maximum')
The model
classifier = make_pipeline(
    make_column_transformer(
        (OneHotEncoder(handle_unknown='ignore'), ['league', 'home_team', 'away_team']),
        remainder='passthrough',
    ),
    SimpleImputer(),
    MultiOutputClassifier(LogisticRegression(solver='liblinear', random_state=7, class_weight='balanced')),
)
The markets are a hyperparameter
Which market to bet is a choice, just as the regularisation of the classifier is a choice. There is no reason to set one by hand and search the other. Put both in the grid and let the search decide.
bettor = BettorGridSearchCV(
    estimator=ClassifierBettor(classifier, init_cash=10000.0, stake=50.0),
    param_grid={
        'classifier__multioutputclassifier__estimator__C': [0.1, 1.0],
        'betting_markets': [['home_win'], ['draw'], ['away_win'], ['home_win', 'draw', 'away_win']],
    },
    cv=TimeSeriesSplit(2),
)
_ = bettor.fit(X_train, Y_train, O_train)
What it chose:
bettor.best_params_
Out:
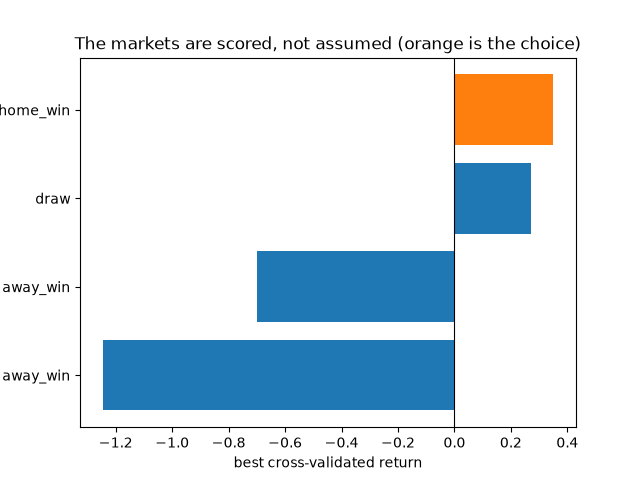
{'betting_markets': ['home_win'], 'classifier__multioutputclassifier__estimator__C': 0.1}
Backtesting the search
The search re-runs inside every fold. So it chooses the markets on the training part of the fold and judges them on the part it has not seen. Choosing them once, on everything, would choose them on the answers.
results = backtest(bettor, X_train, Y_train, O_train, cv=TimeSeriesSplit(3))
results
Out:
                                                       Number of betting days  ...  Yield percentage per bet (draw)
Training start Training end Testing start Testing end                          ...
2023-08-11     2023-10-27   2023-10-27    2024-01-02                      129  ...                              NaN
               2024-01-02   2024-01-02    2024-03-17                      144  ...                              NaN
               2024-03-17   2024-03-17    2024-05-26                      127  ...                            -12.6

[3 rows x 11 columns]
What the search saw
The search scored every set of markets on the same footing as the regularisation. The chart below shows the best score for each set of markets. That score is how the search came to prefer one set over the others. The bar it picked is the choice you would otherwise have made by hand, or worse, by peeking at the answers.
scores = pd.DataFrame(bettor.cv_results_)
scores['markets'] = scores['param_betting_markets'].apply(' + '.join)
best_per_markets = scores.groupby('markets')['mean_test_score'].max().sort_values()
chosen = ' + '.join(bettor.best_params_['betting_markets'])
colours = ['tab:orange' if markets == chosen else 'tab:blue' for markets in best_per_markets.index]

fig, ax = plt.subplots()
ax.barh(best_per_markets.index, best_per_markets.to_numpy(), color=colours)
ax.axvline(0, color='black', linewidth=0.8)
ax.set_title('The markets are scored, not assumed (orange is the choice)')
ax.set_xlabel('best cross-validated return')
Out:
Text(0.5, 23.633333333333333, 'best cross-validated return')
Total running time of the script: ( 0 minutes 2.720 seconds)
Download Python source code: plot_grid_search_bettor.py